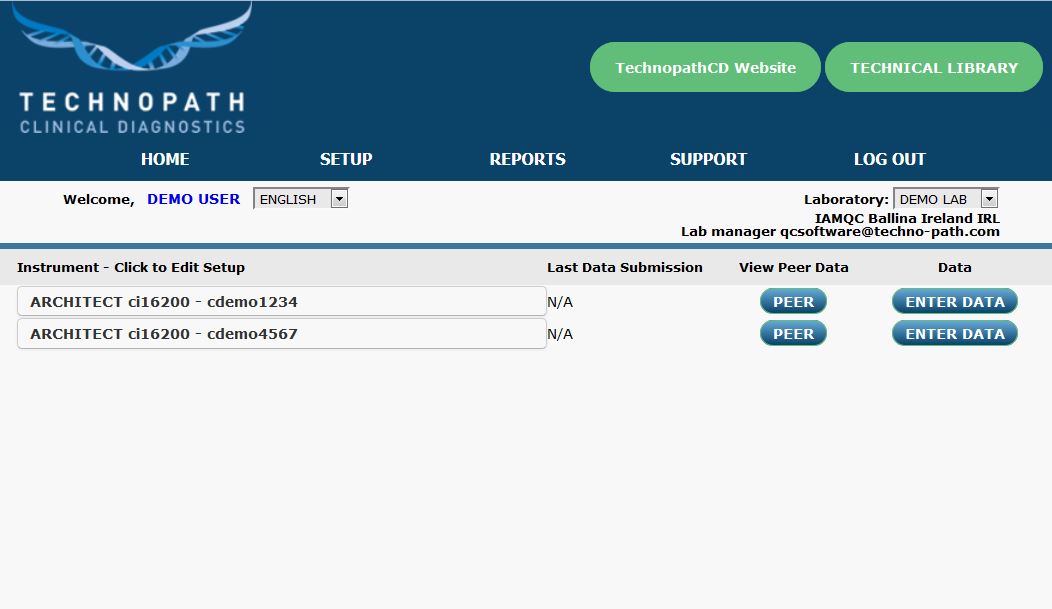
Step 1
Login to IAMQC™ using your USERNAME and PASSWORD.
When the home screen is presented, all of your available instruments are listed.
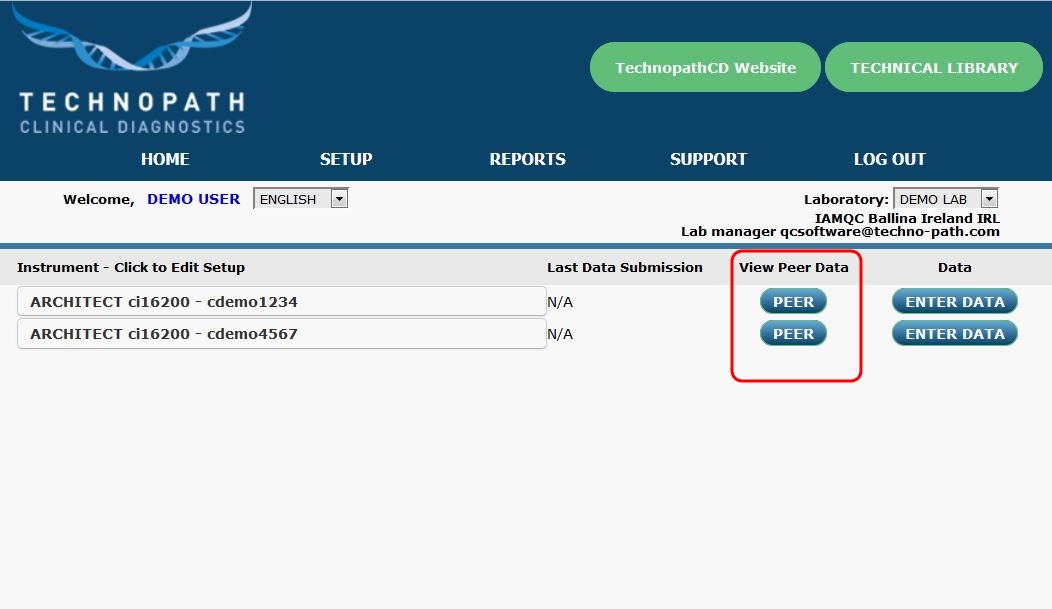
Step 2
When the home screen is presented, click on the PEER button next to your chosen instrument to view its peer statistics.
Step 2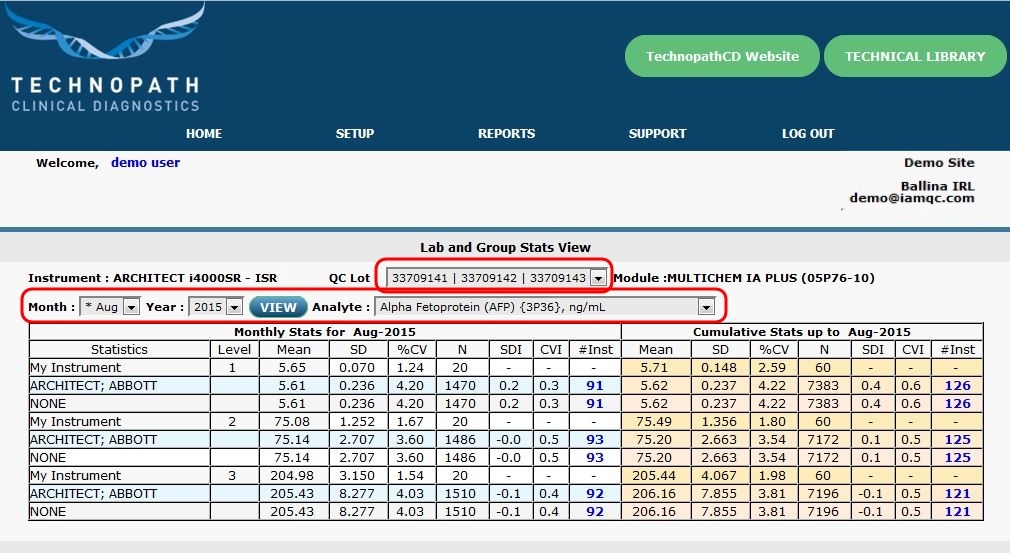
Step 3
In the case that multiple lot numbers of control material are set up on the one instrument, select the LOT number you wish to view from the drop-down menu in the top right corner of the screen.
Set the time period you wish to view from the date section and select the test from the drop-down menu.
Click the VIEW button to apply your selections.
All statistics displayed are calculated in real-time for the preferences previously selected.
Step 4
The interactive table shown displays live results for the selected month, along with cumulative peer statistics for this particular lot of control material.
The first row of the table outlines the performance of your selected instrument.
The second row contains statistics for the Test System Peer Group (all participants using the same Instrument Class, Method and Reagent for the same test/lot of control material).
The third row displays statistics for the Method Principle Peer Group (all participants using the same methodology for the same test/lot of control material).
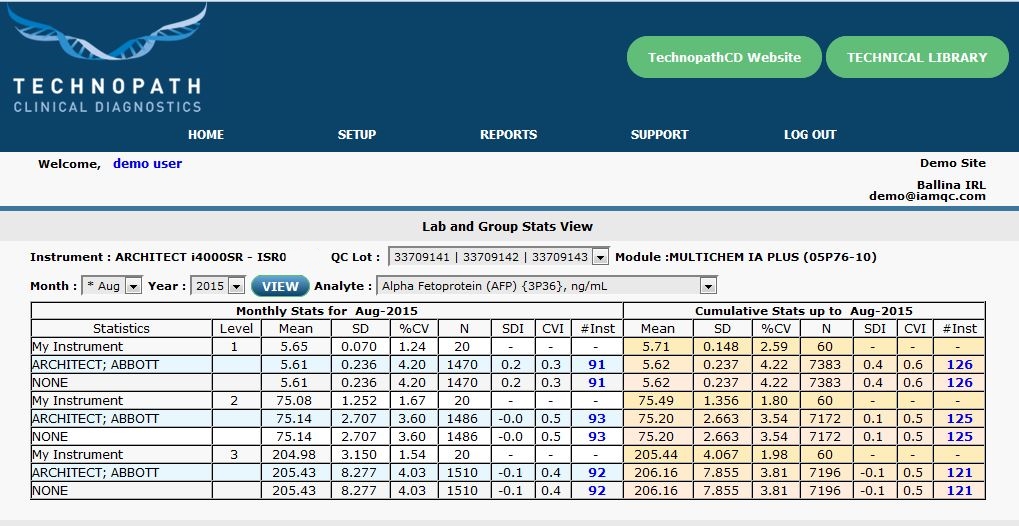
Step 5
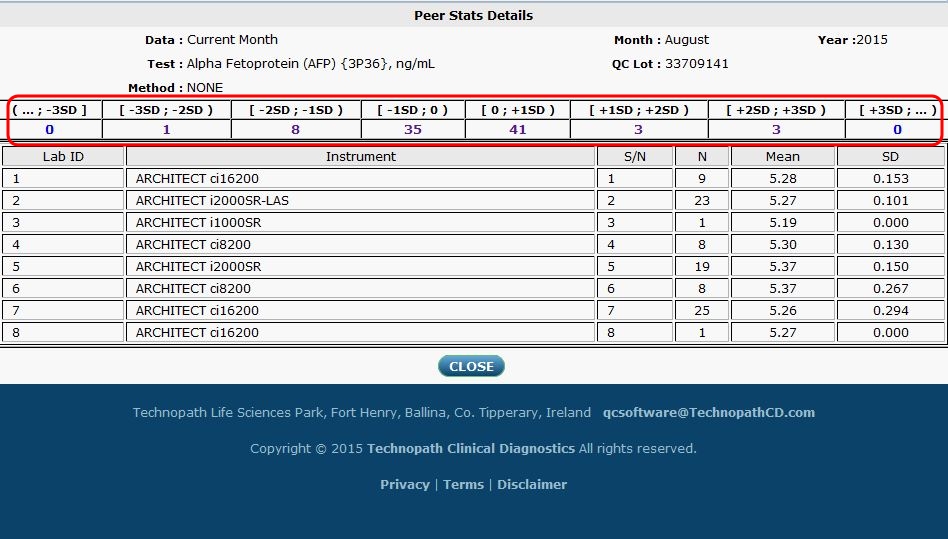
Users can also view the distribution of participants’ results in the selected peer group, displayed in an SD range, by clicking on the blue number in the NUMBER OF INSTRUMENTS column (for the selected month or cumulative results).
A new window opens displaying a Standard Deviation (SD) range table outlining all instruments in the peer group.
Click on the number in each SD range to view individual submissions.